Today Wilco van Boxtel was interviewed by Jessica Walker on Dukascopy TV about the Oil commodity. In this interview Wilco gives his view on the Oil market news with the barrel data development and the chart levels. Let’s look at the interview and some chart levels.
Price story
Oil prices are under intense pressures at present, having reached below 50 dollars per barrel for the first time since 2016. What is driving this pressure in market?
- I think the Huge US Shale production just brought the price down yesterday. It looks more like an Oil war now between US and the Saudi region area in producers landscape. The quest for prevailing OPEC behavior or not.
Harold Hamm, the U.S. shale oil billionaire, warned on Wednesday that the industry could “kill” the crude market if it embarks on another spending binge, with such risks in the market where do you see crude prices moving forward?
- I think 49 is still a tough cookie to crack for oil even for the shale producers. Technically on the chart this is for me also still strong support. So if that still holds I can see higher prices on Oil. It held above there since December 2016. So it still could go to 62 or even 68 just as easy. But yes if 49 goes, then the need to buy with strength fades a bit and we might get stuck in between lower ranges as of 42 and 50.
If oil prices continue falling could OPEC run the risk of driving weaker Opec nations increase their exports of oil?
- That would only lower the price of Oil I think, as we have seen of recent action. As there is no scarcity and the demand rises it is unsure if everybody will start selling and producing more again. Or if the different partners and regions of OPEC can hold and control the cut of everybody involved. Best we can do is follow up this news releases and look at chart levels to make the best decisions.
Is there anything else that you see driving oil prices in the long term?
- The renewable energy, as everybody has said still has low influence. It might pince a dent in the Oil demand going forward. Still industry will require oil for production and robots. So that influence can probably still be balanced for a while.
Price levels of interest
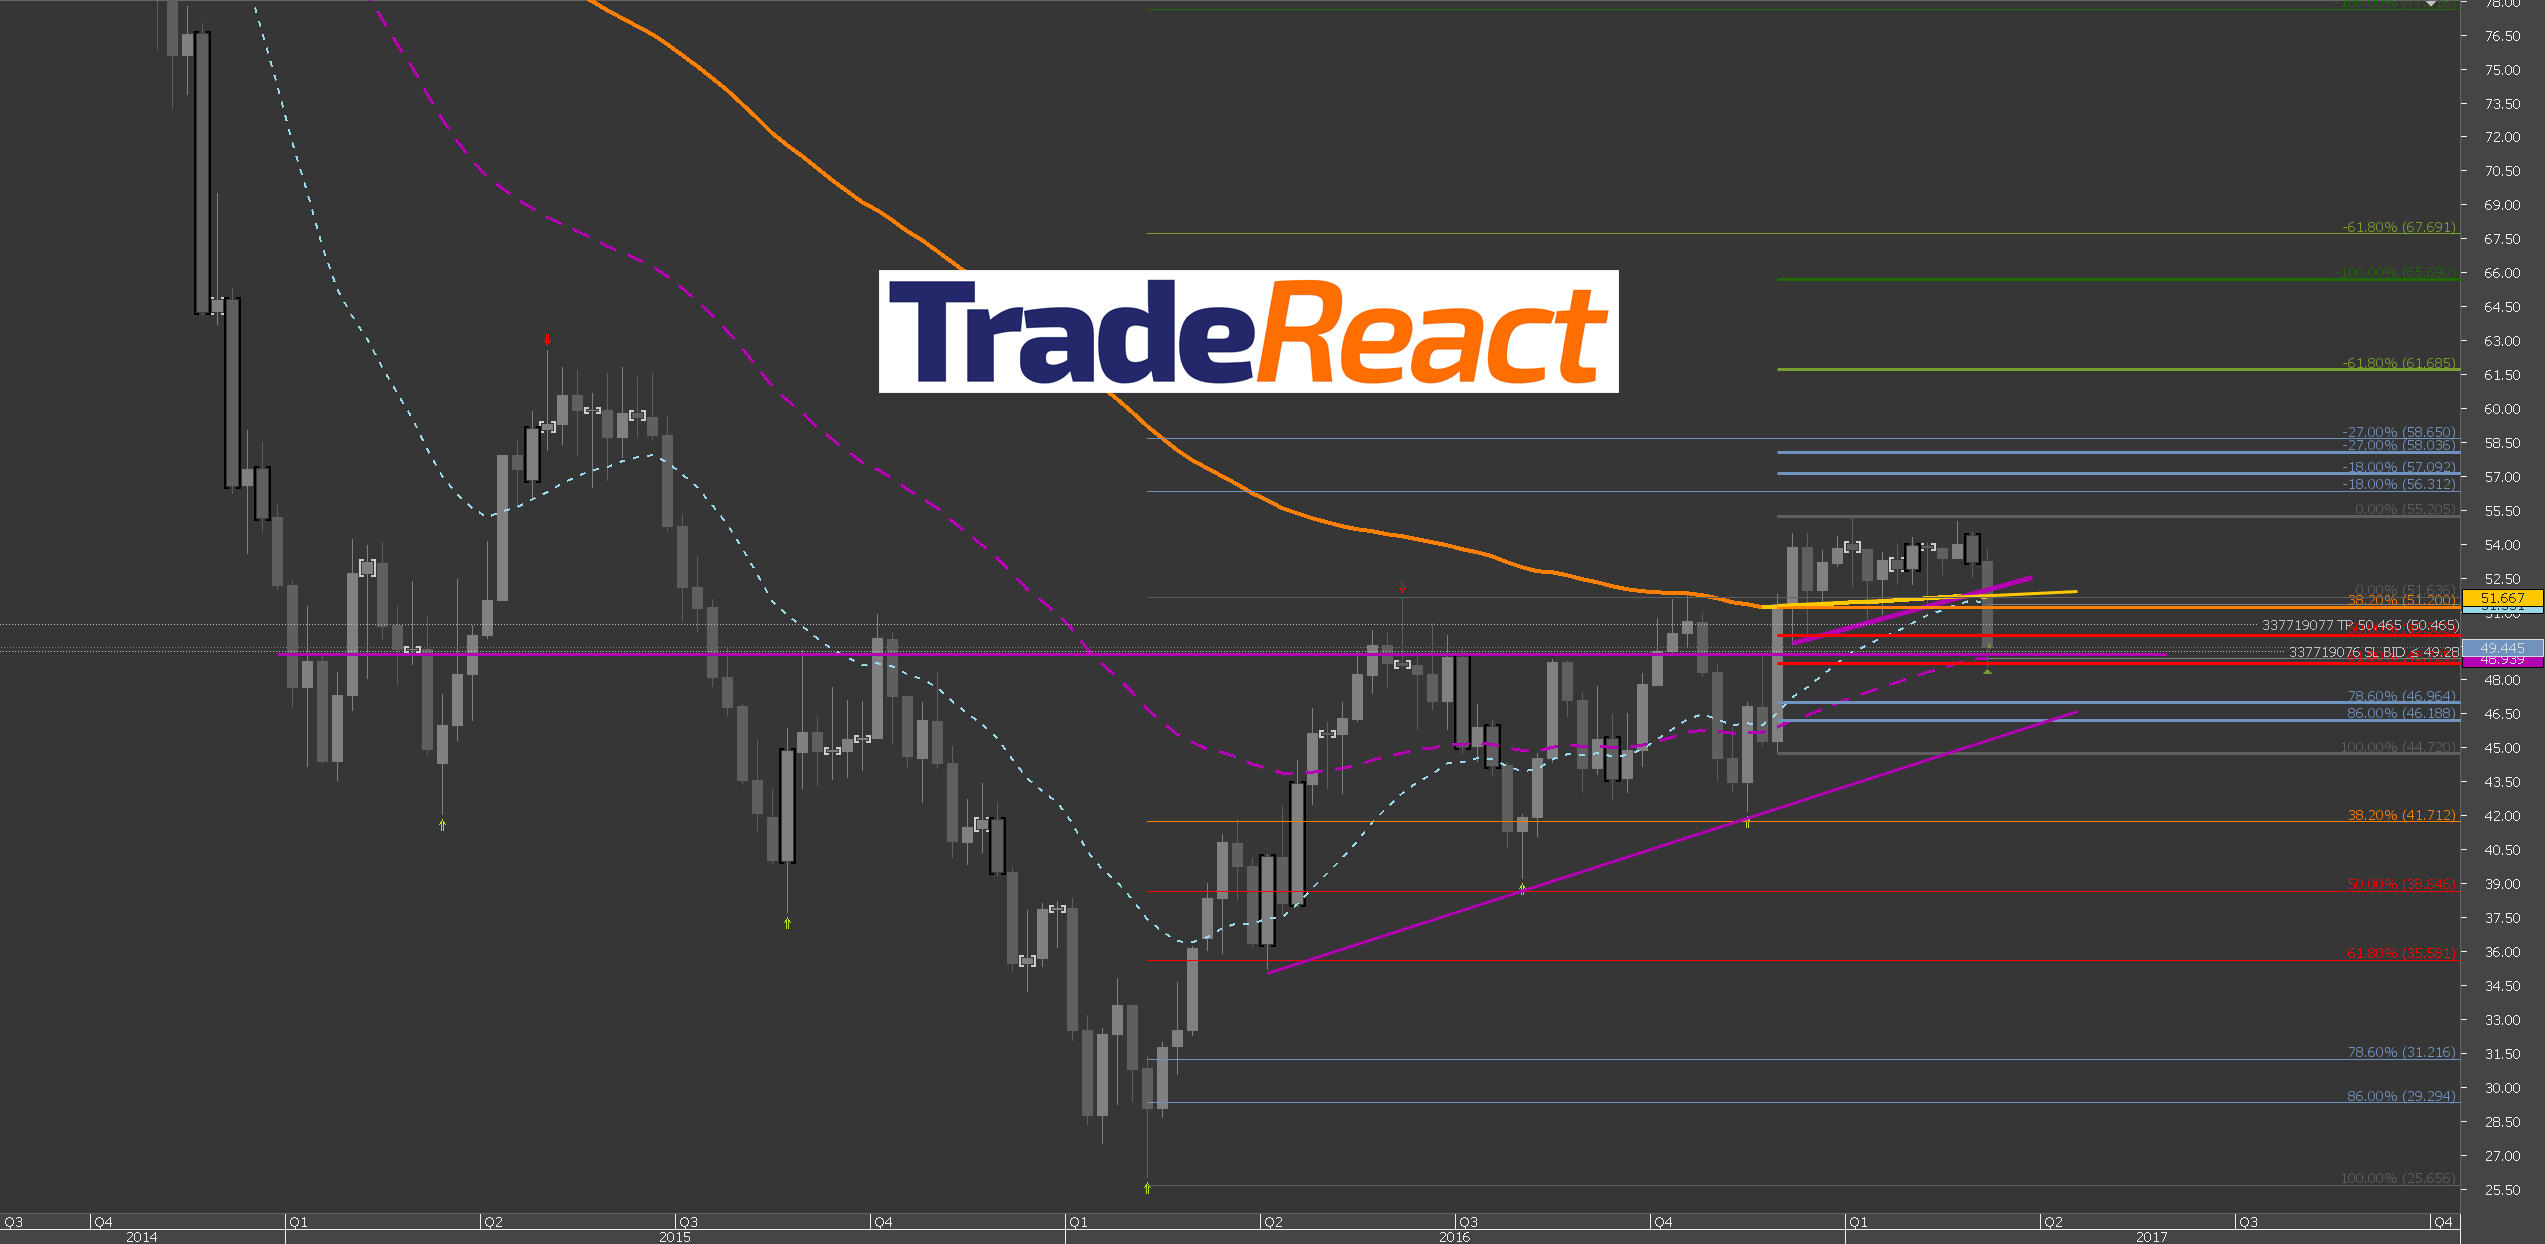
The weekly chart shows three things. Before dropping down, price hovered above EMA momentum. Downtrend getting tested to the upside. Higher lows on the upper purple trendline.
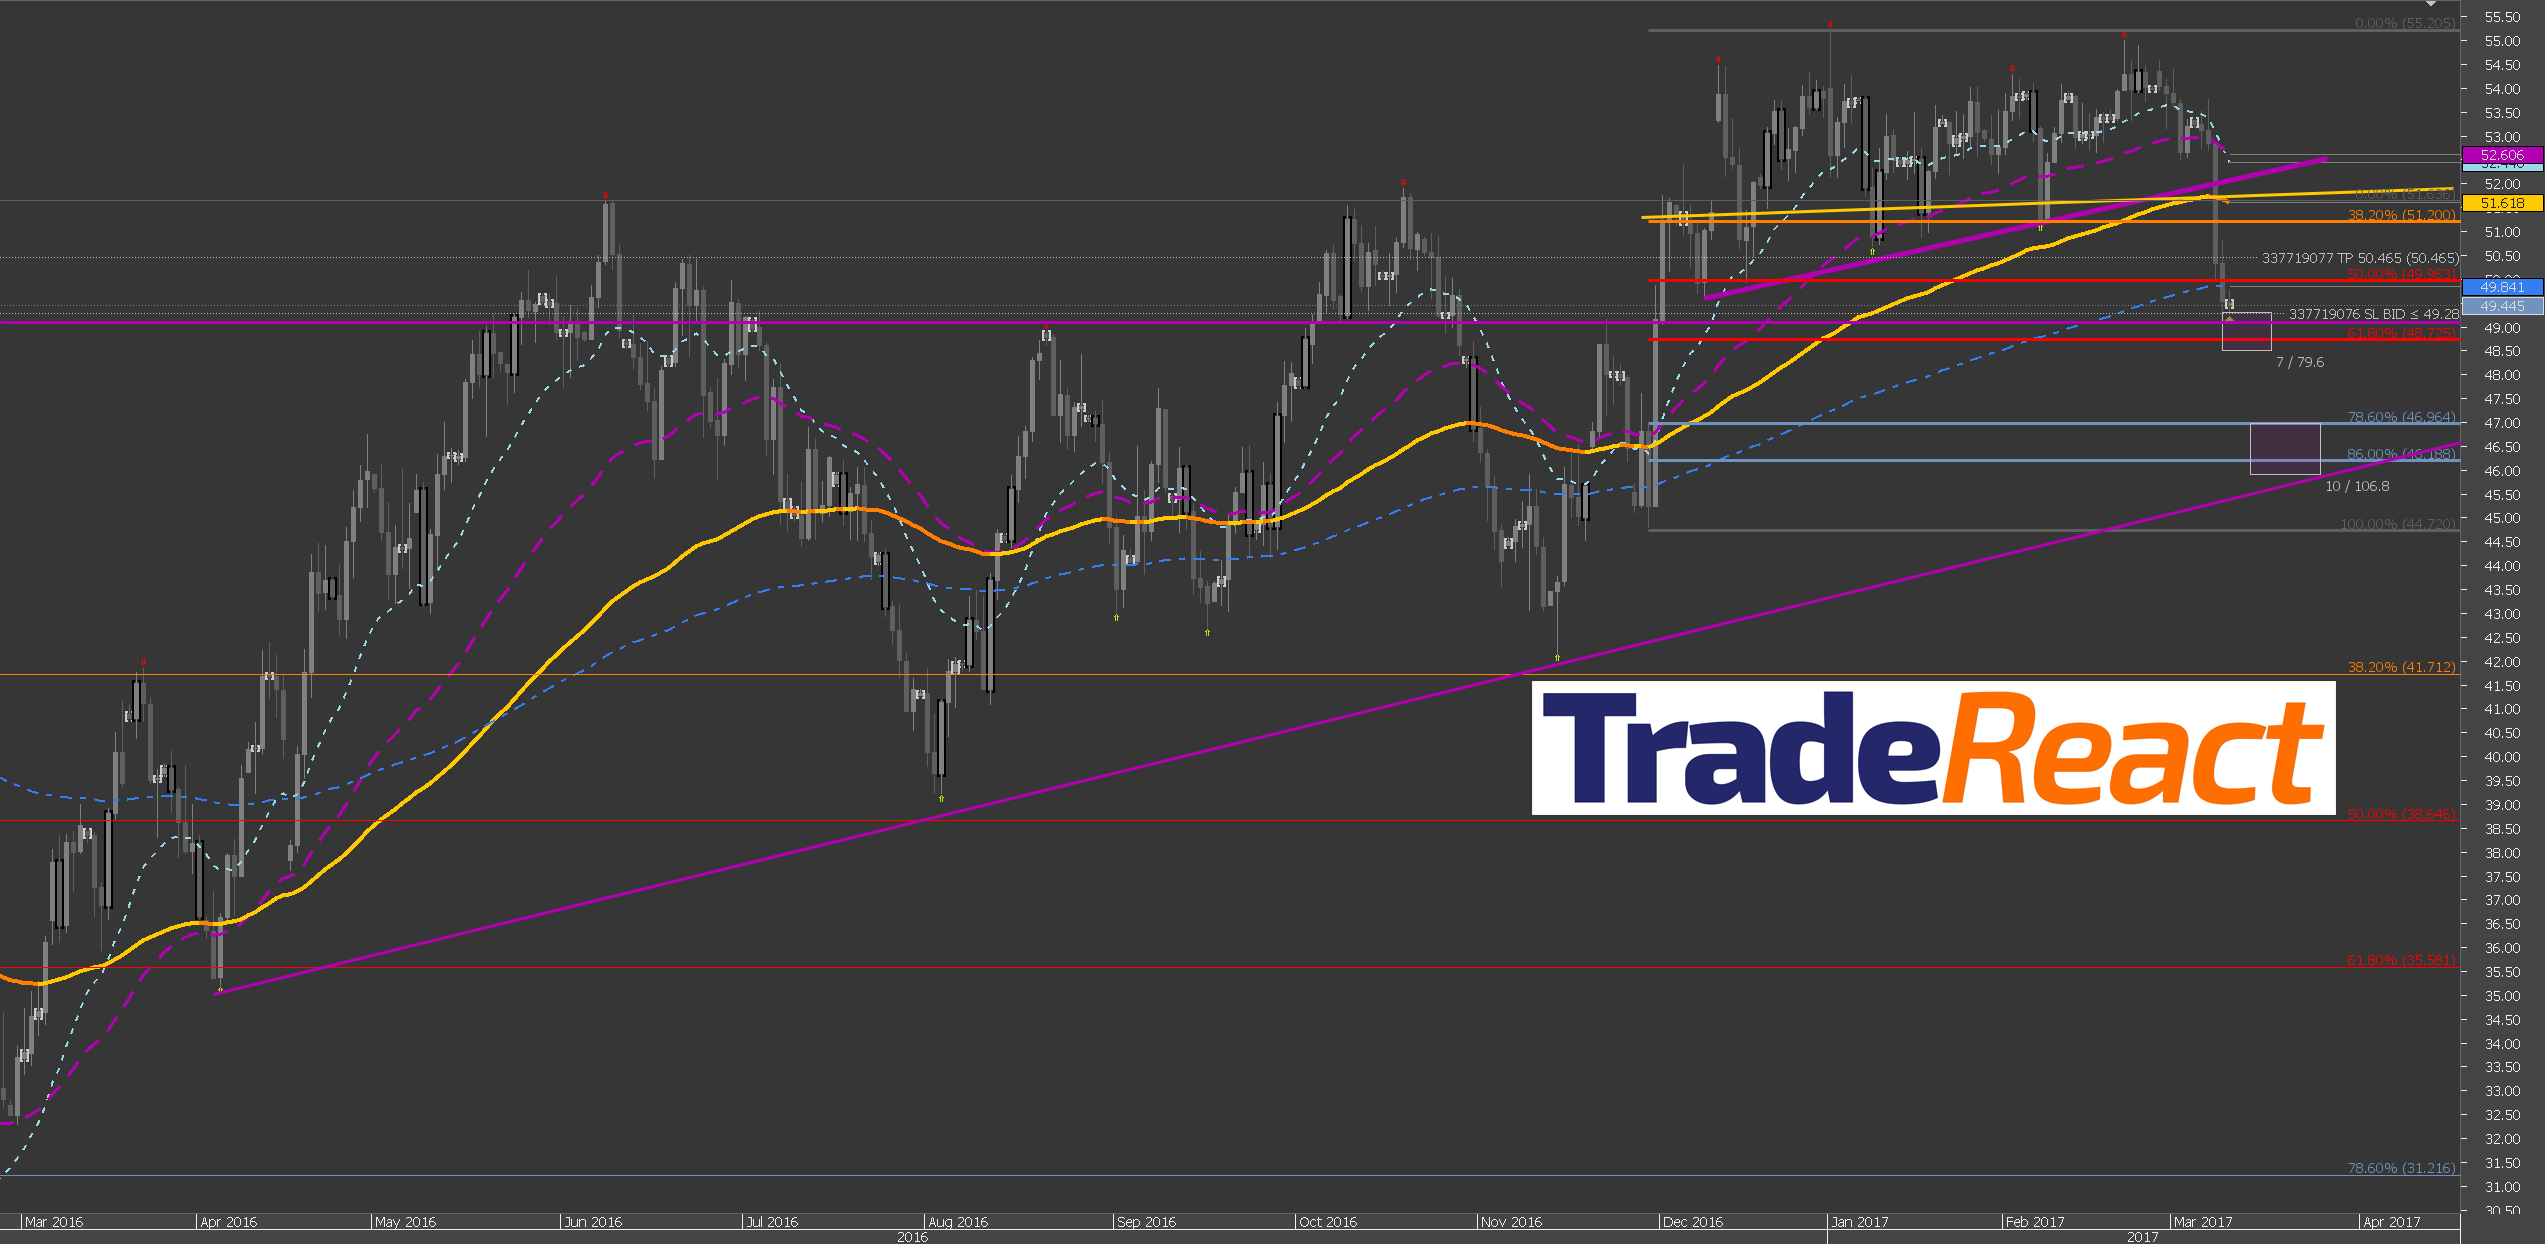
The daily chart shows this in more detail. With a bullish 61.8 Fib touch after the drop. Might be meaningful for profit taking cause today is NFP friday. Possibility to stay in upward move or retracement, even after the drop. From the levels where it is at now 49 or in detail 48.7 or even a low test of 45.50 would still make a higher low. Although bounces from here might get weaker if price closes below 49 more often steadily. A bounce from this area would signal more interest of the downtrend into a new upswing towards higher price levels, near 62 and even 68.